What's Your Dashboard Part One
Our cars are sophisticated pieces of technology, even though the basic mechanics of the combustion engine, suspension and brakes haven’t changed much in decades. What has increased dramatically is the computerization and technology on today’s cars, which have more processing power than the first spaceship sent to the moon.
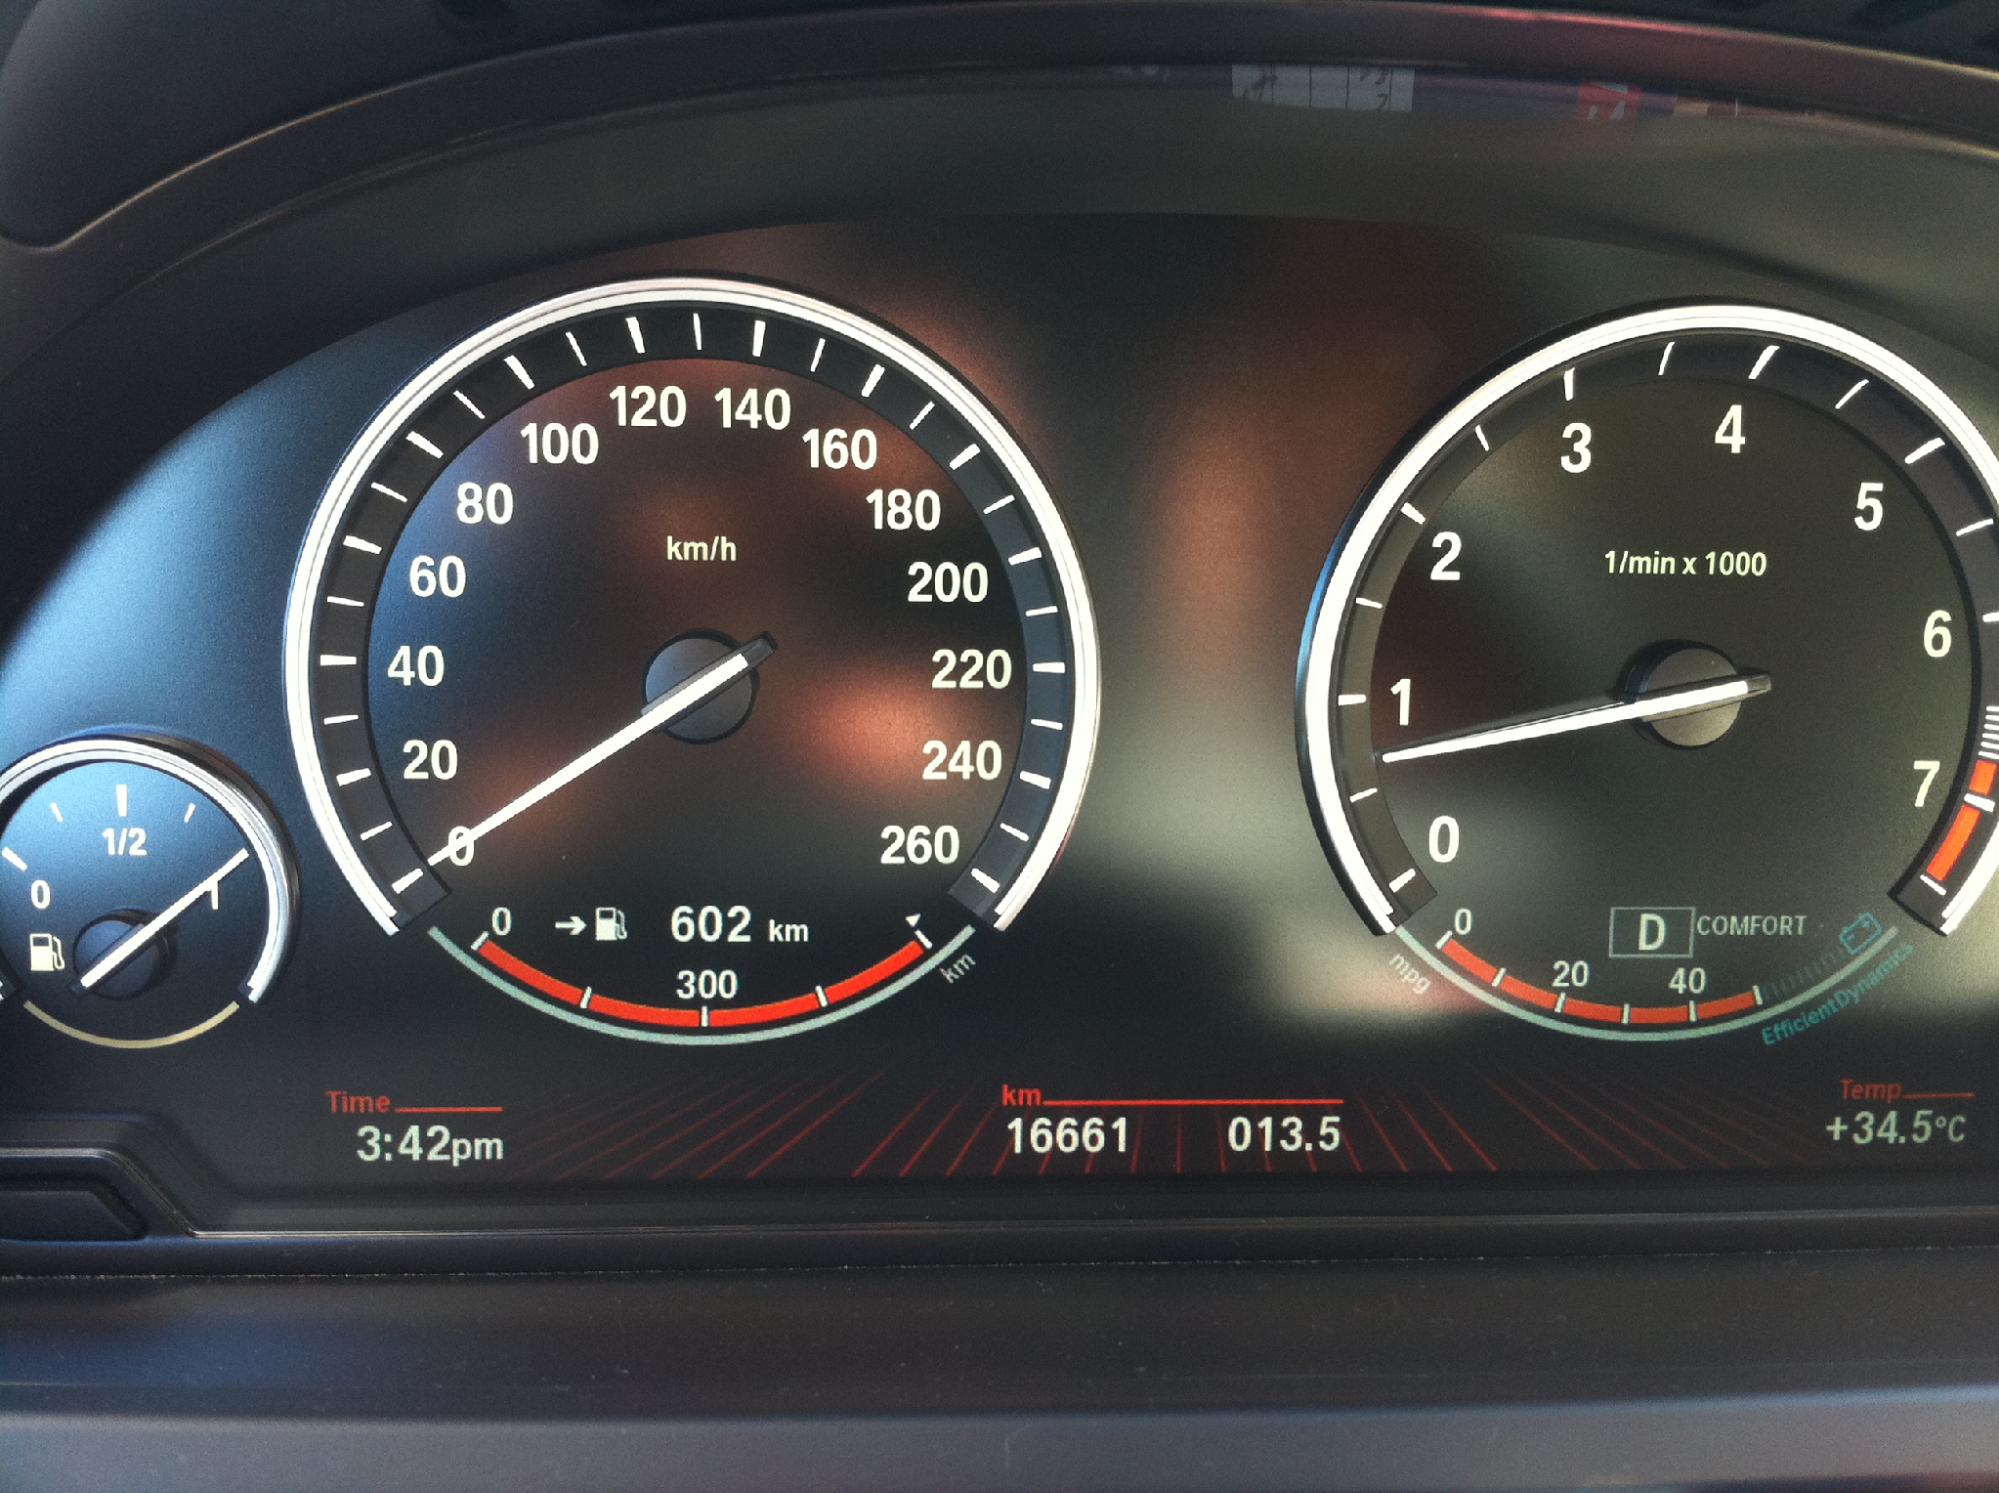
My dashboard has 12 pieces of information, and can be configured to show other information. Note the 34.5C temperature: It was a good day.
The car’s dashboard and computers display tire pressure, transmission oil temperature, current and average fuel consumption, remaining fuel range, perform systems checks and protect us if they detect instability. In fact, along with the global positioning system (GPS), we can now answer the kids “how many more miles?” and tell them exactly how long until the next snack stops. Now if they would only invent a computer to keep the kids quiet…
Your business dashboard should tell you where you are and where you are going, in real time!
These dashboard items will help you to improve your results because you will be focusing on the present and the future, immediately, as they happen.
Actual production – how many units, square feet, hours billed or jobs did you complete yesterday, this week, this month, this year, and how does this compare to the same period last year? Are you going faster? This daily measure can hold the entire company accountable for performance. And, it aligns with keeping your customers happy.
Utilization – how much of your capacity was utilized to produce your goods and services. You can measure individual departments or people or machine output every day. Although no service company will be 100% billable because someone has to attend to marketing and administration, you need to know how billable you actually are, because that’s what generates revenues. This metric alone will predict your future profitability and cash flow.
Order pipeline – how much work has been sold and booked as orders, and how long will this keep you busy into the future. Do you have two weeks or two months of work on order? Where are the gaps and what can you do to fill them in?
Sales pipeline – this lists all your potential sales. It’s one of the most important metrics in your business and also one of the most difficult to estimate because you’re trying to predict the future. Too many businesses don’t even try to record this and that’s wrong. Assign probabilities, make estimates and review your results as they happen. If you don’t track this, your business could face huge risks and you might run out of cash. You can use a simple spreadsheet that is updated daily for potential sales and probabilities, or you can use a reputable Customer Relationship Management software, like Salesforce.com or Sugar, that provides online access and great reporting.
Cash and resources – how much cash or operating credit do you have and how long will this sustain you going forward? Do you have two months of resources or only two weeks and therefore need to proactively manage your working capital, collections and payables? Spending time juggling cash will take you away from other important management actions like improving profits and increasing sales. You need everyone to pay attention to cash because all decisions, such as selecting customers, allocating resources, purchasing, staffing and invoicing, have a direct impact on cash.
Which of these metrics are you using in your business? If you had this information available to you, how would you be able to improve your business performance and profit?
You can use this table to assess your business dashboard.
If you can’t measure what’s going on in your business every day, how can you control it?
From The Piggy Bank
When it comes to operational information, speed is more important than accuracy.


