
Profit Potential Baseline
Profit Potential – What’s Your Base Line Efficiency?
How can you increase profits by 20% or more next year? Ask your marketing folks and accounting department that question and see what happens. They’ll probably have some great ideas or become moderately terrified or both. After all, isn’t increasing your profits their responsibility?
Here’s how you can assess your own profit potential.
When we perform Potential Profit Audits™ for our clients, the first step we start with is the numbers: Not the dollars, but the actual numbers of production in your business. This may be billable hours or units produced or square feet or percentage complete. This activity generates revenues. What is your daily production number? Is it going up or down? Why? Don’t know?
The number will be higher on a ‘good day’ when everything works, nothing breaks, everyone shows up, the parts are all received and organized. This higher number represents your “base line efficiency” and this is what you want to increase. On a ‘bad day,’ there will be problems and production will be lower, or bad (zero) or even terrible (negative – due to waste or errors).
Don’t use the average of your good days and bad days because this gives everyone an excuse to make excuses. If your team can produce on a good day, they should be able to produce at that level every day and continually improve from there. If they can’t, well, it’s management’s (i.e. your) fault.
In the short term, most of your costs are fixed: labour, overheads, advertising, and so on. Only the materials used in production and some utility or energy costs are variable in the short term. Therefore, increasing your production is the first step to increasing your profits.
If you increase your production by 3% each day, what will the impact be on your revenues and on your profits? If you are a service firm and your average billable percentage is 67%, increasing by 3% to 70% will generate significant profits. Whatever your business or industry, increasing your base line efficiency will have a dramatic impact on your bottom line.
For example, if you have 50 employees working a 40 hour week, and you increase the billable percentage from 67% to 70%, the numbers are described in the following paragraphs. For a free copy of the Base Line Efficiency Spreadsheet, click here.
50 employees x 40 hours/week x 44 weeks/year (assumption: allows for vacation, statutory holidays), your production capacity is 92,000 hours. Assuming 67% billable (=production of 61,640 hours) at $100 per hour, your annual service revenues are $6,164,000 (92,000 hrs x 67% x $100/hr). If you have profit equal to 10% net income after tax, you have profit of $616,400 at this level of production.
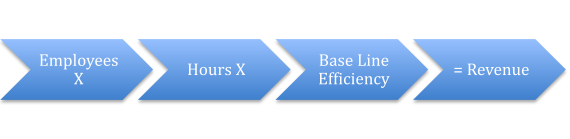
Now, if you increase the billable percentage to 70%, the numbers are 92,000 hours x 70% (=production of 64,400 hours) x $100 per hour, equals revenues of $6,440,000 or an increase of $276,000. This will all be profit because you’re already paying all the wages, overheads and other expenses. Assuming tax is 30%, that leaves $193,200 in after-tax profit. ($276,000 x (100%-30%)=$193,200)

You’ve increased profit from $616,400 to $809,600 by increasing base line efficiency from 67% to 70%, or a profit increase of 31.3% (193,200/616,400=31.3%).
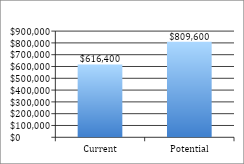
Let’s recap: Increasing your billable percentage from 67% to 70% generated an increased profit of 31.3%. That’s the power of raising your base line efficiency.
Just think what would happen if you tweaked five or ten key activities in your business.
Tough Question
Are you measuring your base line efficiency every day?
From The Piggy Bank
You can create big profits by making small improvements to what happens every day.
Share the Wealth
Here is a copy of the spreadsheet:
Definitions and Assumptions
46 weeks per year allows vacation and statutory holidays.
We define profit as the net income after tax.
'Net to gross' measures profit as a percentage of revenues.


