Dissecting Your Profits
Do you remember the queasy feeling while dissecting things in high school biology class? Dissecting your profits will be a lot less messy. However, what you might learn about your business might still make you queasy.
Let’s look at a company with $10 million in annual revenues and that sells three main products. I’m going to present the example in a typical, although summarized, financial statement format.
Table 1: Financial Data
Dissection
If you dissect by revenues, product A seems to be the most important because it’s the largest.
If you dissect by gross profit (GP), product C has the highest GP dollars and percentage.
If you allocate your general and administrative expenses to each product line (based on volume of transactions or head count, for example), product A incurs a loss (this should make you queasy), and products B and C are profitable, with product C generating almost the entire annual profit.
Product B’s profit of $400,000 essentially offsets product A’s losses of $300,000. That’s a lot of work-70% of total revenues-for a low profit of $100,000. This should make you very queasy. Almost three quarters of your efforts are generating one-ninth of the results from the other quarter of your efforts. Now, that’s dissection!
Analyzing financial statements is hard work and takes time. For many busy entrepreneurs, a chart can tell the story much faster and more effectively than pages of financial statements. Here is what the table data looks like.
Chart 1: Product Financial Data
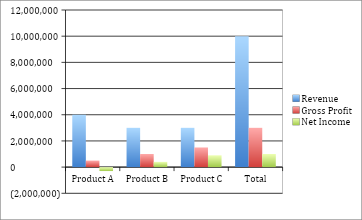
Chart 1 makes it easier to see the product line performance but hides Product A’s losses due to the magnitude of the other numbers. For even more power, and to reduce distraction and confusion, I recommend showing only the most critical information in a chart. This is what the net income chart, below, shows us.
Chart 2: Product Net Income
Everyone can see instantly that there is a problem with product A, product B is doing pretty good, but product C is doing very well.
Based on the above information, what would you do?
Many people will try to fix the loss on product A and ignore products B and C because they’re doing well. That’s the wrong response. We need to maximize C because we always need to build on strengths (with people, as well). The fastest way to fix A is to starve it and shift resources, sales and efforts from A to B and C.
If you’re an entrepreneur, owner/manager or president, then be assertive and demand that your accounting department report the important information graphically so that you can instantly assess performance. You can always request more detail later, once the queasiness settles down.
What information exists in your business that could be dissected and presented in charts to improve your analysis and decision-making?
From The Piggy Bank
Never let your business potential be constrained by your accounting system (or people). If it can’t give you the information you need to run your business in real time, get a better system. This is no place to pinch pennies. A good accounting system will make you money. An information system that integrates your sales pipeline information, operations and accounting information will help you to make even more money.


